
Show code cell source
import networkx as nx
import matplotlib.pyplot as plt
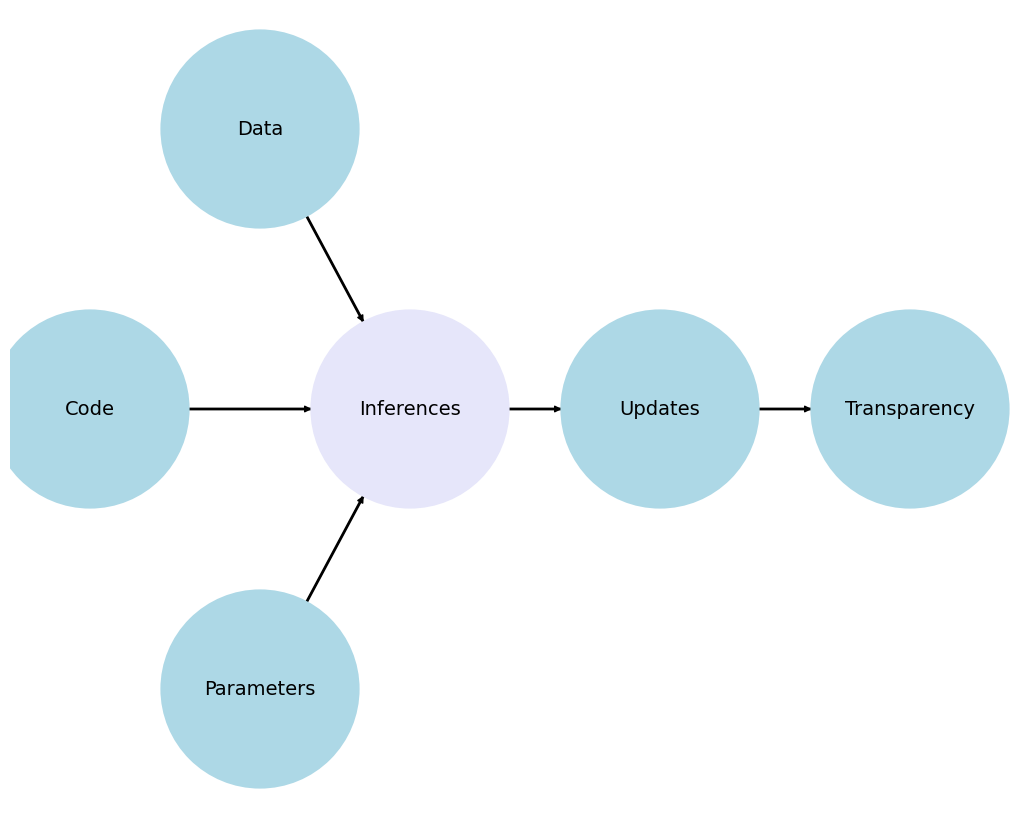
G = nx.DiGraph()
G.add_node("Data", pos=(-2500, 700))
G.add_node("Code", pos=(-4200, 0))
G.add_node("Inferences", pos=(-1000, 0))
G.add_node("Parameters", pos=(-2500, -700))
G.add_node("Updates", pos=(1500, 0))
G.add_node("Transparency", pos=(4000, 0))
G.add_edges_from([("Data", "Inferences")])
G.add_edges_from([("Code", "Inferences")])
G.add_edges_from([("Parameters", "Inferences")])
G.add_edges_from([("Inferences", "Updates")])
G.add_edges_from([("Updates", "Transparency")])
pos = nx.get_node_attributes(G, 'pos')
labels = {"Inferences": "Inferences",
"Data": "Data",
"Code": "Code",
"Parameters": "Parameters",
"Updates": "Updates",
"Transparency": "Transparency"} # Added label for "NDI" node in the labels dictionary
# Update color for the "Scenarios" node
node_colors = ["lightblue","lightblue", "lavender", "lightblue", "lightblue", "lightblue"]
# node_colors = ["lightblue","lavender", "lavender", "lightgreen", "lightpink", "lightpink"]
# Suppress the deprecation warning
import warnings
warnings.filterwarnings("ignore", category=DeprecationWarning)
plt.figure(figsize=(10, 8))
nx.draw(G, pos, with_labels=False, node_size=20000, node_color=node_colors, linewidths=2, edge_color='black', style='solid')
nx.draw_networkx_labels(G, pos, labels, font_size=14) # , font_weight='bold'
nx.draw_networkx_edges(G, pos, edge_color='black', style='solid', width=2)
plt.xlim(-5000, 5000)
plt.ylim(-1000, 1000)
plt.axis("off")
plt.show()
6 GitHub Repository for Collaboration#
This week, we’ll apply the skills we’ve developed over the past five weeks to create a GitHub repository, which will serve as the basis for our projects in the coming weeks. The aim is not to achieve perfection initially, but to establish a foundation that can be built upon, potentially with the help of peers.
Objectives:#
Create a Public GitHub Repository:
Set up a repository named
projecton GitHub. You will be working individually, but you are encouraged to use GitHub Discussions to seek help from your peers when needed.
Utilize Publicly Available Data:
The focus will be on using public data to explore the significance of “self-reported health” as a health indicator.
Documentation and Transparency:
Document your project comprehensively using a
README.mdfile and other necessary documentation to make your analysis accessible and understandable. Embrace the principles of Open Science which are Rigor, Reproducibility, and Responsibility.
Detailed Steps and Resources:#
6.1 Data Acquisition and Preparation:#
Survey Data:
Import the survey data from the 1999-2000 National Health and Nutrition Examination Survey (NHANES):
import sasxport5 "https://wwwn.cdc.gov/Nchs/Nhanes/1999-2000/DEMO.XPT", clear
Mortality Follow-up Data:
Obtain follow-up mortality data to analyze over a 20-year period from the National Center for Health Statistics (NCHS). Detailed linkage instructions are available on the Linked Mortality page:
Health Statistics
NCHS
Datalinkage
Linked Mortality
NHANES_1999_2000_MORT_2019_PUBLIC.datStata_ReadInProgramAllSurveys.do
 //data
 global mort_1999_2000 https://ftp.cdc.gov/pub/HEALTH_STATISTICS/NCHS/datalinkage/linked_mortality/NHANES_1999_2000_MORT_2019_PUBLIC.dat

 //code
cat https://ftp.cdc.gov/pub/HEALTH_STATISTICS/NCHS/datalinkage/linked_mortality/Stata_ReadInProgramAllSurveys.do
6.2 Code Development:#
Edit and Rename Provided Script:
Download, modify, and upload the provided Stata
.dofile for linking the DEMO.XPT data to mortality follow-up data. Rename this file tofollowup.doand commit it with the description: “Updated DEMO.XPT linkage .do file”. In otherwords, download, modify, and uploadStata_ReadInProgramAllSurveys.do. You may watch the week 6 video for the key items to edit. For instance, you may edit it so that it reads in the data directly from the website.
Data Merging:
Execute the following Stata code to merge the survey data with the mortality data, ensuring alignment on the unique sequence numbers:
//use your own username/project repo instead of the class repo below
global repo "https://github.com/jhustata/intermediate/raw/main/"
do ${repo}followup.do
save followup, replace
import sasxport5 "https://wwwn.cdc.gov/Nchs/Nhanes/1999-2000/DEMO.XPT", clear
merge 1:1 seqn using followup
lookfor follow
6.3 Key Parameters for Week 7s Analysis:#
Self-Reported Health Assessment:
Import the specific health questionnaire data and prepare it for analysis in Week 7:
import sasxport5 "https://wwwn.cdc.gov/Nchs/Nhanes/1999-2000/HUQ.XPT", clear
🔑
Here’s a first iteration of a script that answers they project main goal. Save it as project.do and upload it to you repo. Keep updating it over the next two weeks, with a meaningful commit statement each time for version control.
global repo "https://github.com/jhustata/intermediate/raw/main/"
do ${repo}followup.do
save followup, replace
import sasxport5 "https://wwwn.cdc.gov/Nchs/Nhanes/1999-2000/DEMO.XPT", clear
merge 1:1 seqn using followup
lookfor follow
lookfor mortstat permth_int eligstat
keep if eligstat==1
capture g years=permth_int/12
codebook mortstat
stset years, fail(mortstat)
sts graph, fail
save demo_mortality, replace
import sasxport5 "https://wwwn.cdc.gov/Nchs/Nhanes/1999-2000/HUQ.XPT", clear
merge 1:1 seqn using demo_mortality, nogen
sts graph, by(huq010) fail
stcox i.huq010
6.4 Inferences#
Please review documentation for the file HUQ.XPT, which includes the variable huq010
Employ 95%CI and p-values
The following snippet will lay the foundation for your statistical, clinical, and public health inferences:
merge 1:1 seqn using demo_mortality, nogen
sts graph, by(huq010) fail
stcox i.huq010
Write a brief abstract-style conclusion But learn a little more about the simple questionnaire item of interest to this project:
import sasxport5 "https://wwwn.cdc.gov/Nchs/Nhanes/1999-2000/HUQ.XPT", clear
huq010
desc huq010
codebook huq010
I have some general questions about your health. Would you say your health in general is:
Excellent
Very good
Good
Fair
Poor?
You task is to provide rigorous and reproducible evidence that responsibly answers this very simple, but overlooked “screener” in both clinical and public health settings.
6.5 Upcoming Updates and Critiques:#
Critique a Recent Article:
Engage with recent literature, such as this study, to cursorily consider your approach to this simple question vs. the approach these authors took. What is the key difference?
Plan for Generalizing the Analytic Script:
Adapt your script to handle similar data from any period between 1999 and 2019.
6.6 Documentation and Reproducibility:#
6.7 Lab#
Setting Up Your GitHub Project#
Objective: Set up a GitHub repository for collaborative health data analysis.
Tasks:
Create a GitHub Repository: Follow the provided instructions to create a public GitHub repository named
project. Make sure the repository settings allow for discussions and issues to encourage collaboration.Initial Commit:
Add a
README.mdfile explaining the project’s purpose, how to contribute, and a brief description of the data sources used (DEMO.XPT and mortality linkage data).Commit these changes with a meaningful message, such as “Initial commit with README.md”.
Instructions:
Use the GitHub interface to create and configure the repository.
Write the
README.mdfile using Markdown formatting to make it clear and engaging.Include links to the data sources and any relevant documentation or tutorials that might help collaborators.
Copy & paste the content of the
README.mdinto a new file calledindex.md.Click on settings once done
Activate
pagesas you did in previous homeworksThis will create a URL for your project, accessible even to those who don’t have GitHub accounts
Improve the aesthetic and usability of this website each week
6.8 Homework#
Submit the URL of your GitHub Page. Ensure it is set to public so it can be accessed and reviewed.
Next week you’ll include results from your analysis and some beautiful graphics (see section 6.3 above for your foundational code)