r(mean)#
Today we are going to talk about
macros:
Local system macros
name
content

 c() -> constants (`help creturn`)
 r() -> return values
 e() -> estimated values
User-defined macros
 local e.g., `m_iqr'
 global e.g., $workdir
But we need data to demonstrate these macros. So lets curate a dataset: nh3andmort.dta
Copy & paste the script below into a .do file and do!
You may save it as nh3andmort.do. If you encounter any trouble in this preliminary step please do post it on CoursePlus. Maybe a fellow student or a member of the teaching team may be able to help.
Import data for todays class:
Your Stata edition will determine how much data is imported. Can you tell which line of code in the script determines this? (Hint: it is an
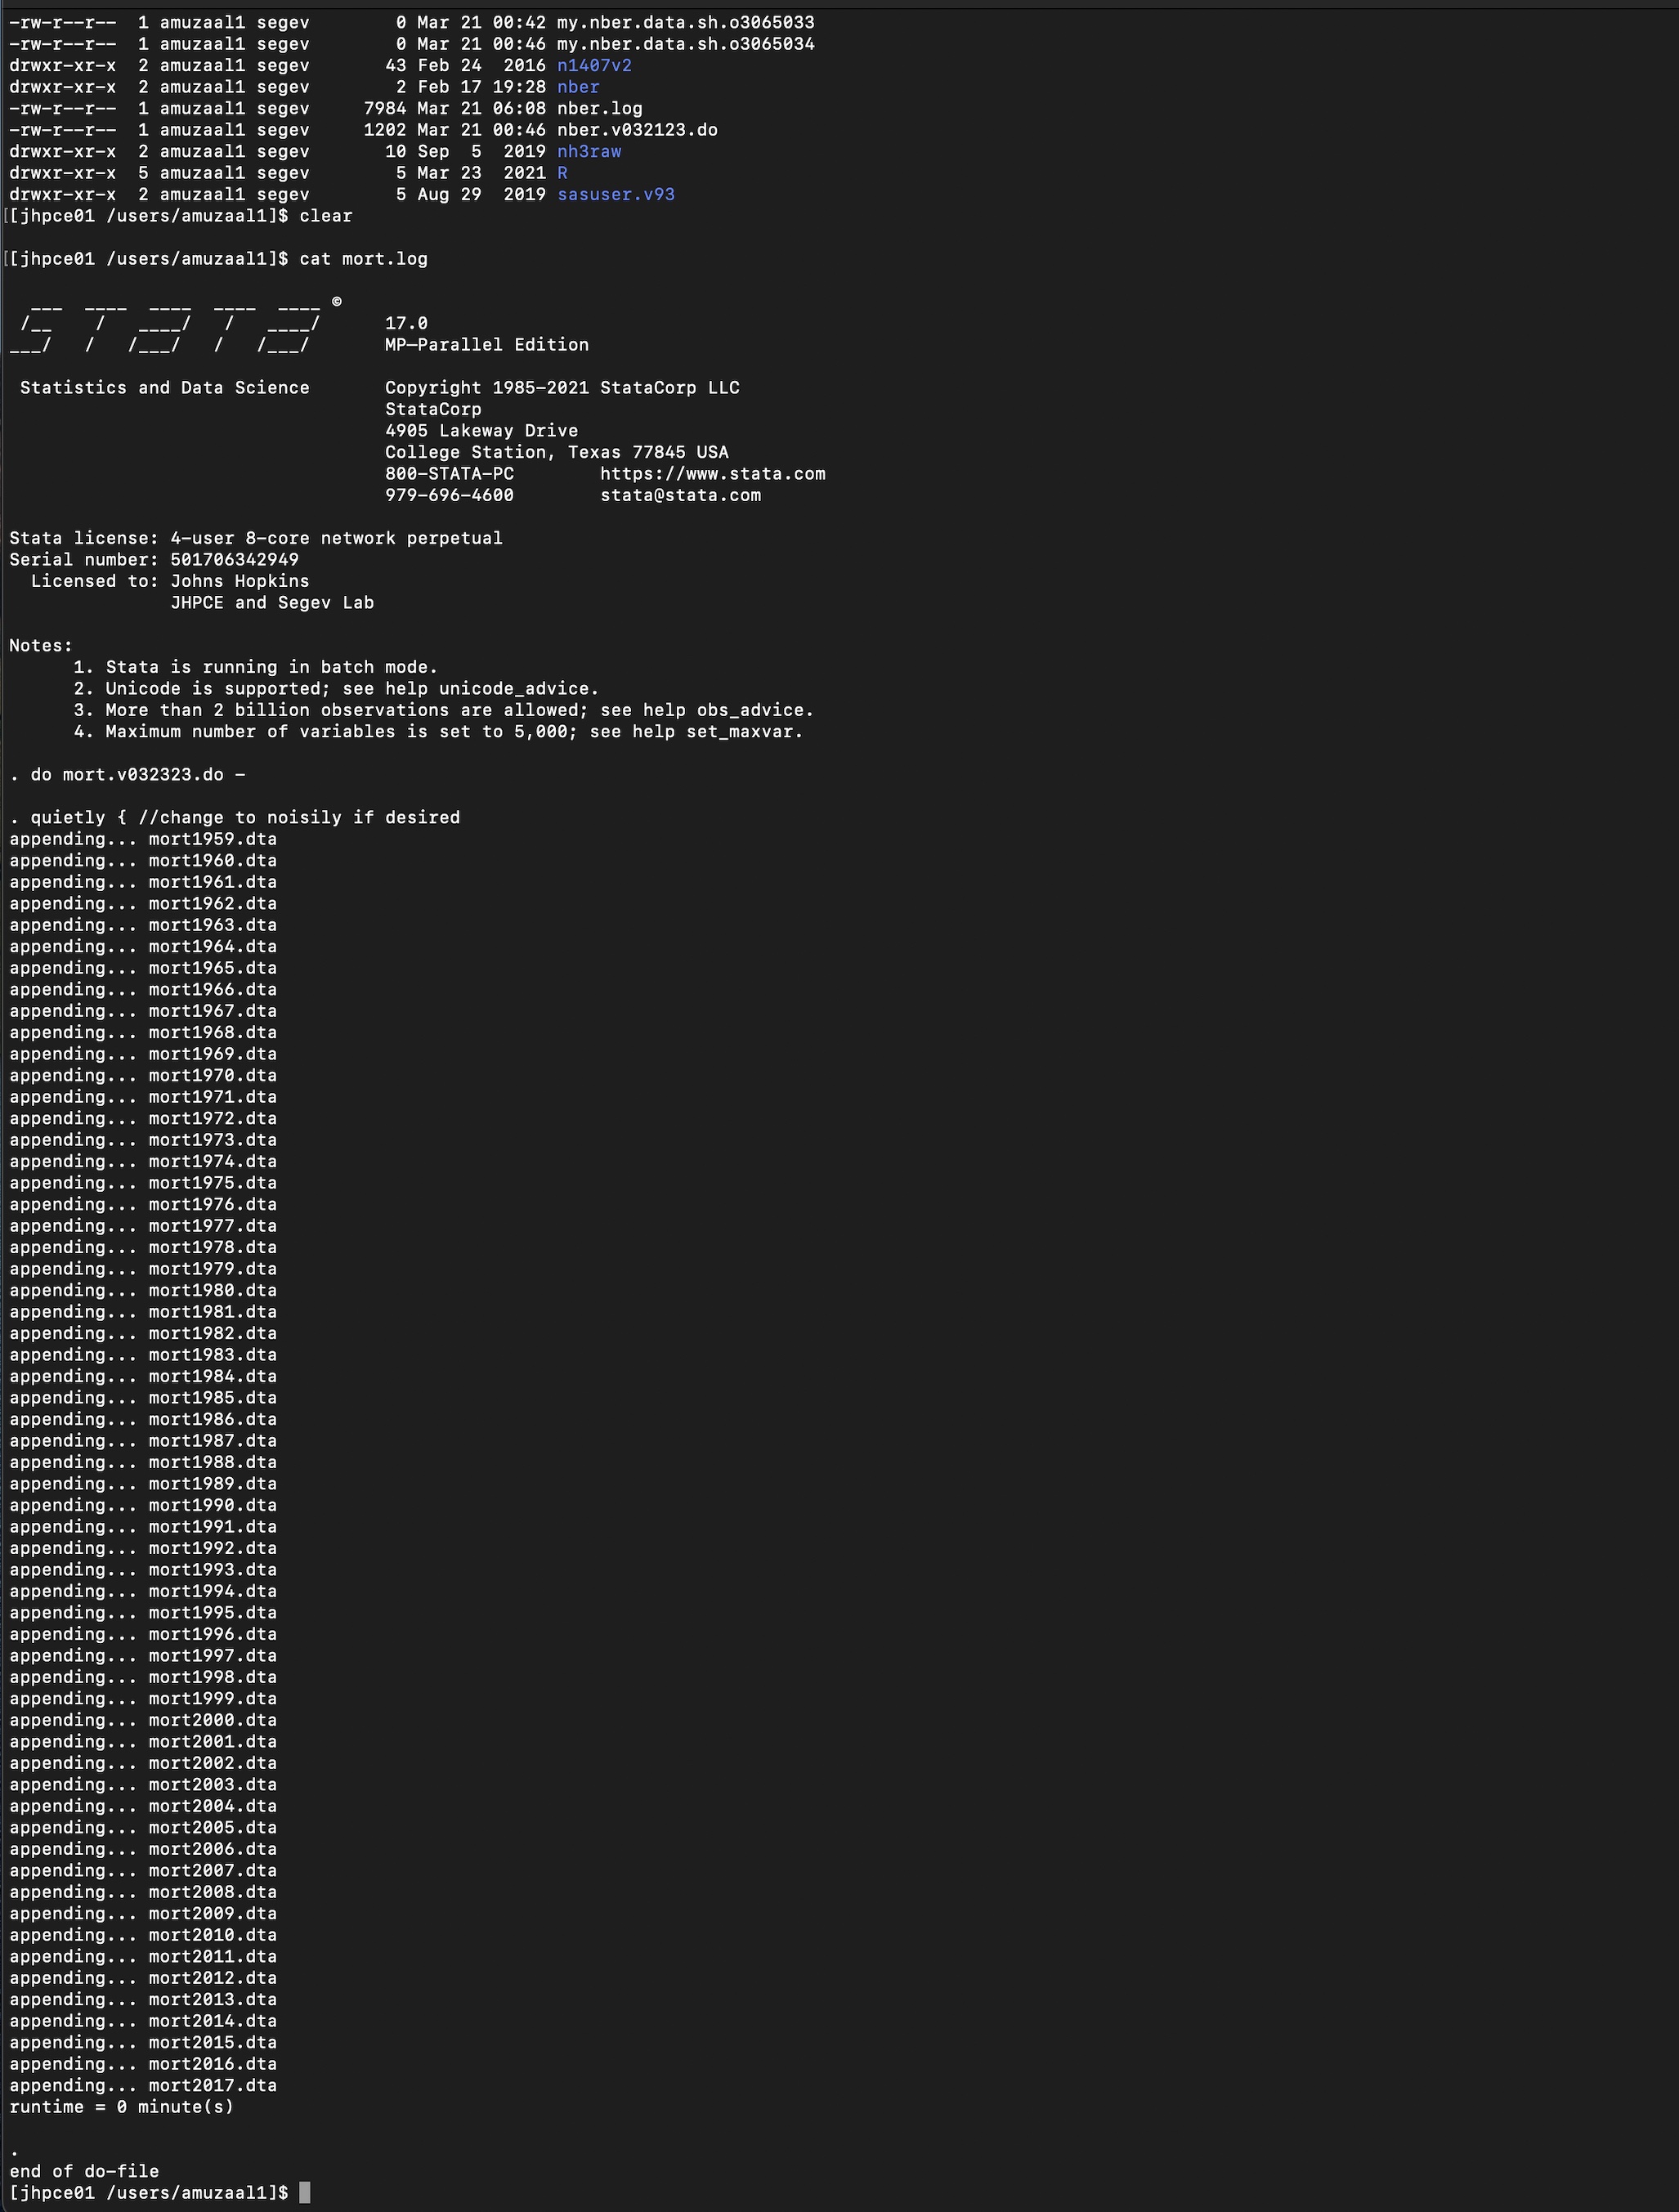
if xxx {statement but at a lower structural level than theif int {building blocks of our .do file). This line of code was motivated by Stata/BE editions that the majority of students have, which proved incapable of handling the fullnh3andmort.dtadatafile.Here is a screenshot from a Stata/MP session on the biostatistics cluster.
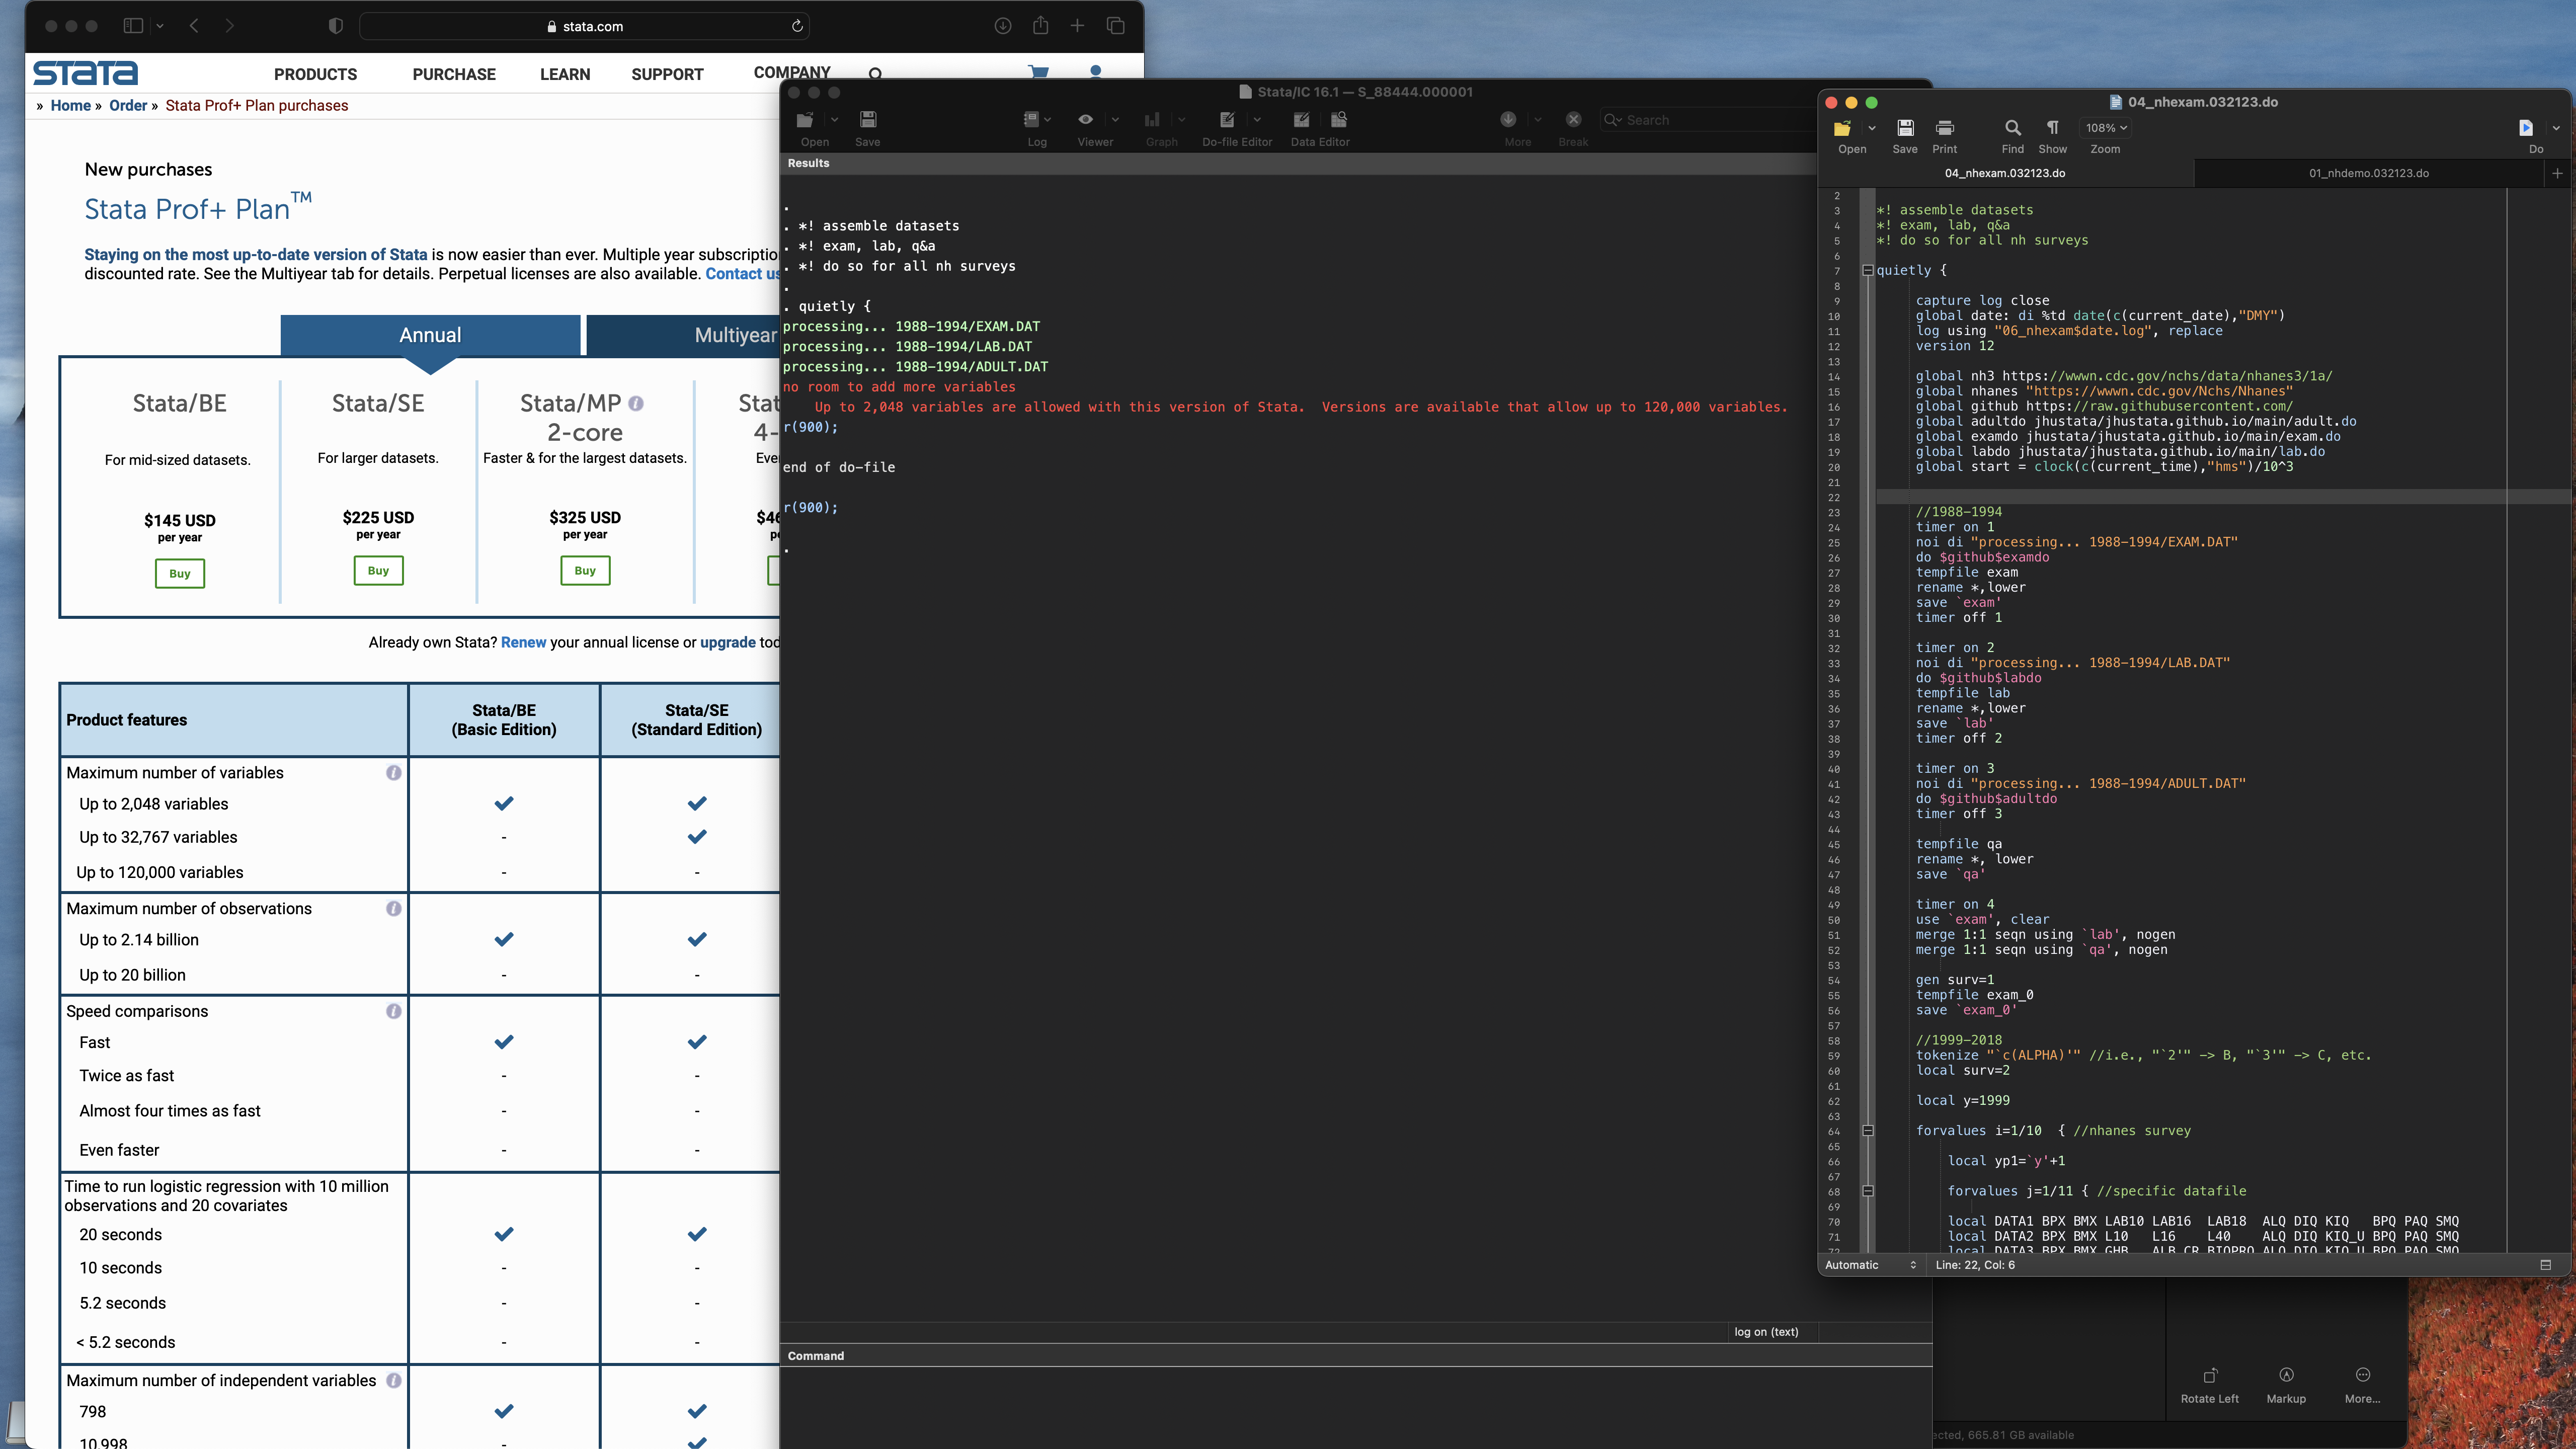
And here is a screenshot from a Stata/IC session that crashed when attempting to import the
nh3andmort.dtadatafile. (Stata/IC was rebranded Stata/BE in 2022)Watch this video supplement to learn more about what motivated this discussion of Stata editions.
capture program drop nhanes
program define nhanes

	preserve

		qui {

			if 0 { //background:r(mean)

				1. Stata/BE or IC
				2. c(k) < 2048
				3. exam.DAT: c(k) == 2368
				4. inaccessible to jhustata
				5. program to grant access

			}

			if 1 { //methods:$keepvars

				timer on 1

				global github https://raw.githubusercontent.com/
				global jhustata jhustata/book/main/
				global keepvars HSAGEIR BMPHT BMPWT HAZA8AK1 CEP GHP HAB1

				timer off 1

			}

			if 2 { //results:.dofiles

			    timer on 2

				clear

				do ${github}${$jhustata}nh3mort.do

				if c(edition_real) == "BE"  | c(edition_real) == "IC" {

					clear

					do ${github}${$jhustata}nhanes-alpha-if2.do

				}

				else {

					clear

					do ${github}${$jhustata}nhanes-alpha-if0.do

				}


				timer off 2

			}

			if 3 { //conclusions:queueing

			    timer on 3

			    timer on 31
				clear
				do adult.do
				rename *,lower
				save adult.dta,replace
				timer off 31

				timer on 32
				clear
				do exam.do
				rename *,lower
				save exam.dta,replace
				timer off 32

				timer on 33
				clear
				do lab.do
				rename *,lower
				save lab.dta,replace
				timer off 33

				timer off 3

			}

			if 4 { //acknowledge:linkage

				timer on 4

				use adult, clear
				merge 1:1 seqn using exam,nogen
				merge 1:1 seqn using lab,nogen
				merge 1:1 seqn using nh3mort,nogen keep(matched)

				timer off 4

			}

			if 5 { //reference:dataset4class

				timer on 5

				compress
				lab dat "NHANES 1988-1994, survey & mortality"
				save "nh3andmort.dta", replace

				timer off 5

			}

			if 6 { //task001:survivalanalysis

				timer on 6

        		lookfor mort
        		codebook mortstat
        		lookfor follow
        		g years=permth_exm/12

        		lookfor health
        		codebook hab1
        		global subgroup: var lab hab1

        		stset years, fail(mortstat)

        		#delimit ;
        		sts graph if inrange(hab1,1,5),
        		   by(hab1)
        		   fail
        		   ti("Mortality in NHANES III",pos(11))
        		   subti("by self report: ${subgroup}",pos(11))
        		   yti("%",orientation(horizontal))
        		   xti("Years")
        		   per(100)
        		   ylab(0(20)80,
        		       format(%3.0f)
        		       angle(360)
        		   )
        		   legend(on
        		       lab(1 "Excellent")
        		       lab(2 "Good")
        		       lab(3 "Fair")
        		       lab(4 "Bad")
        		       lab(5 "Poor")
        		       ring(0)
        		       pos(11)
        		       col(1)
        		       order(5 4 3 2 1)
        		   )
        		   note("Source: RDC/NCHS/CDC/DHHS")
        		;
        		#delimit cr

        		graph export nh3andmort.png,replace

        		stcox i.hab1 if inrange(hab1,1,5)


				timer off 6

			}

			noi timer list

		}

	restore

end

nhanes
Code-block if 6 { can be reused in any future survival analysis, with a few edits. You may accumulate a catalog of such codeblocks for your personal use or for sharing with others. Here I catalog this codeblock as task001 for future reference. Another generalizable codeblock may be labelled task002.
Explore the versatility of macros:
Now let’s explore return values, macros, and our first programs with nh3andmort.dta:
    sum hsageir
    return list
Let’s add a slight variation to this theme:
    sum hsageir, detail
    return list
Display some of these summary statistics within a sentence
di "In this population of `r(N)' adult participants identified from NHANES III, the median age was `r(p50)' years (IQR, `r(p25)'-`r(p75)')"
Whatever is held within a backquote (just below the esc key) and a forward quote is a local macro.
And what is punctuated with a dollar sign is a global macro.
Please scroll down this Stata document for a formal definition of these two types of macros.
Some local macros will be defined by the user with a local name command syntax.
But in other scenarios local macros will automatically be generated by Stata.
Think of the commands return list, foreach, forvalues, etc.
foreach v of varlist hsageir bmpht bmpwt haza8ak1 cep ghp  {

    qui summ `v', detail
    di "The median `v' is `r(p50)' (IQR, `r(p25)'-`r(p75)')"

}
In the above example “v” fits the Stata definition of a local macro.
And we gave it its name in the foreach v statement.
Let’s make the above output more appealing by naming a few macros (syntax: local name) and defining their content (syntax: local name: di “something” or local name = 3)
foreach v of varlist hsageir bmpht bmpwt haza8ak1 cep ghp  {

    qui summ `v', detail
    local p25: di %5.1f r(p25)
    local p50: di %5.1f r(p50)
    local p75: di %5.1f r(p75)
    di "The median `v' is `p50' (IQR, `p25'-`p75')"

}
In the above example we have replaced the return values, r(), with three new macros: p50, p25, and p75. The content of these macros is essentially a format of display (%5.1f). We immediately witness the effect of these macros on the output. Let’s delve a little more into the aesthetics of the output:
foreach v of varlist hsageir bmpht bmpwt haza8ak1 cep ghp  {

    qui summ `v', detail
    local m_iqr: di  %5.1f _col(30) r(p50) " (IQR, " %5.1f r(p25) "-" %5.1f r(p75) ")"
    di "The median `v' is `m_iqr'"

}
Much better. But one more thing…
rename (hsageir bmpht bmpwt haza8ak1 cep ghp)(Age Height Weight SBP SCreat HbA1c)

foreach v of varlist Age Height Weight SBP SCreat HbA1c  {

    qui summ `v', detail
    local m_iqr: di  %5.1f _col(30) r(p50) " (IQR, " %5.1f r(p25) "-" %5.1f r(p75) ")"
    di "The median `v' is `m_iqr'"

}
Finally something of publication quality!
We have used a loop command to perform the same task over and over on different variables.
These variables have all been Continuous. Do you want to perform a similar loop function on
binary and multicategory variables? Binary: sex, history of hypertension, history of diabetes, history of smoking;
Multicategory: race and education. This will be a nice way to look through the script from last weeks chapter: pwd.
Meanwhile, amongst your several outputs from running the script that produced nh3andmort.dta is the figure below:
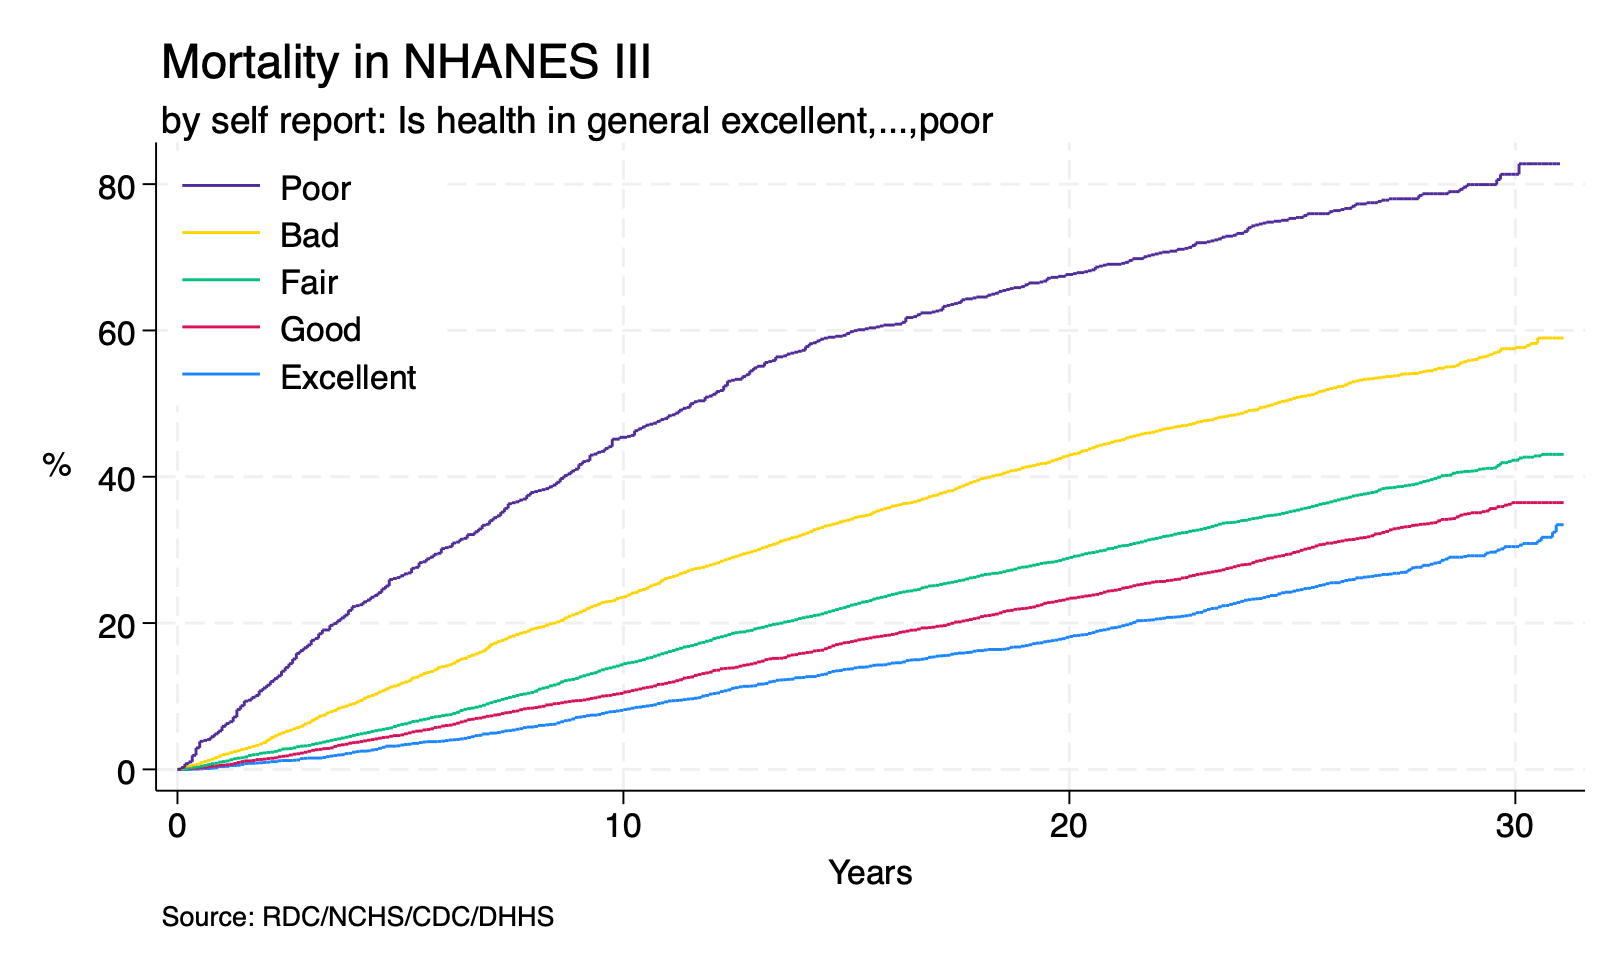
Can you tell what content of this graph is specified by a macro?
Let’s now move on to regression output. Lets set up the data for Cox regression:
   desc permth_exm
   g years=permth_exm/12
We’ll use years as the time variable and mortstat as the event.
stset years, fail(mortstat)
Now we are all set for Cox regression
stcox i.hab1 if inrange(hab1,1,5)
How may we extract return values following a regression model? Because of the potential for so many coefficients in regression, we have to specify which specific coefficient we are interested in, thus:
   lincom _b[2.hab1]
   return list
   di exp(r(estimate))
This should look familiar: a command, return list, and the display of a select group of return values.
Now lets do something a few of you may find parsimonious and delicious:
stcox i.hab1 if inrange(hab1,1,5)
return list
matrix define m=r(table)
matrix list m
di m[1,2]
Hope you like that!