rnormal()#
Twoway plot of grades from 2021/2022
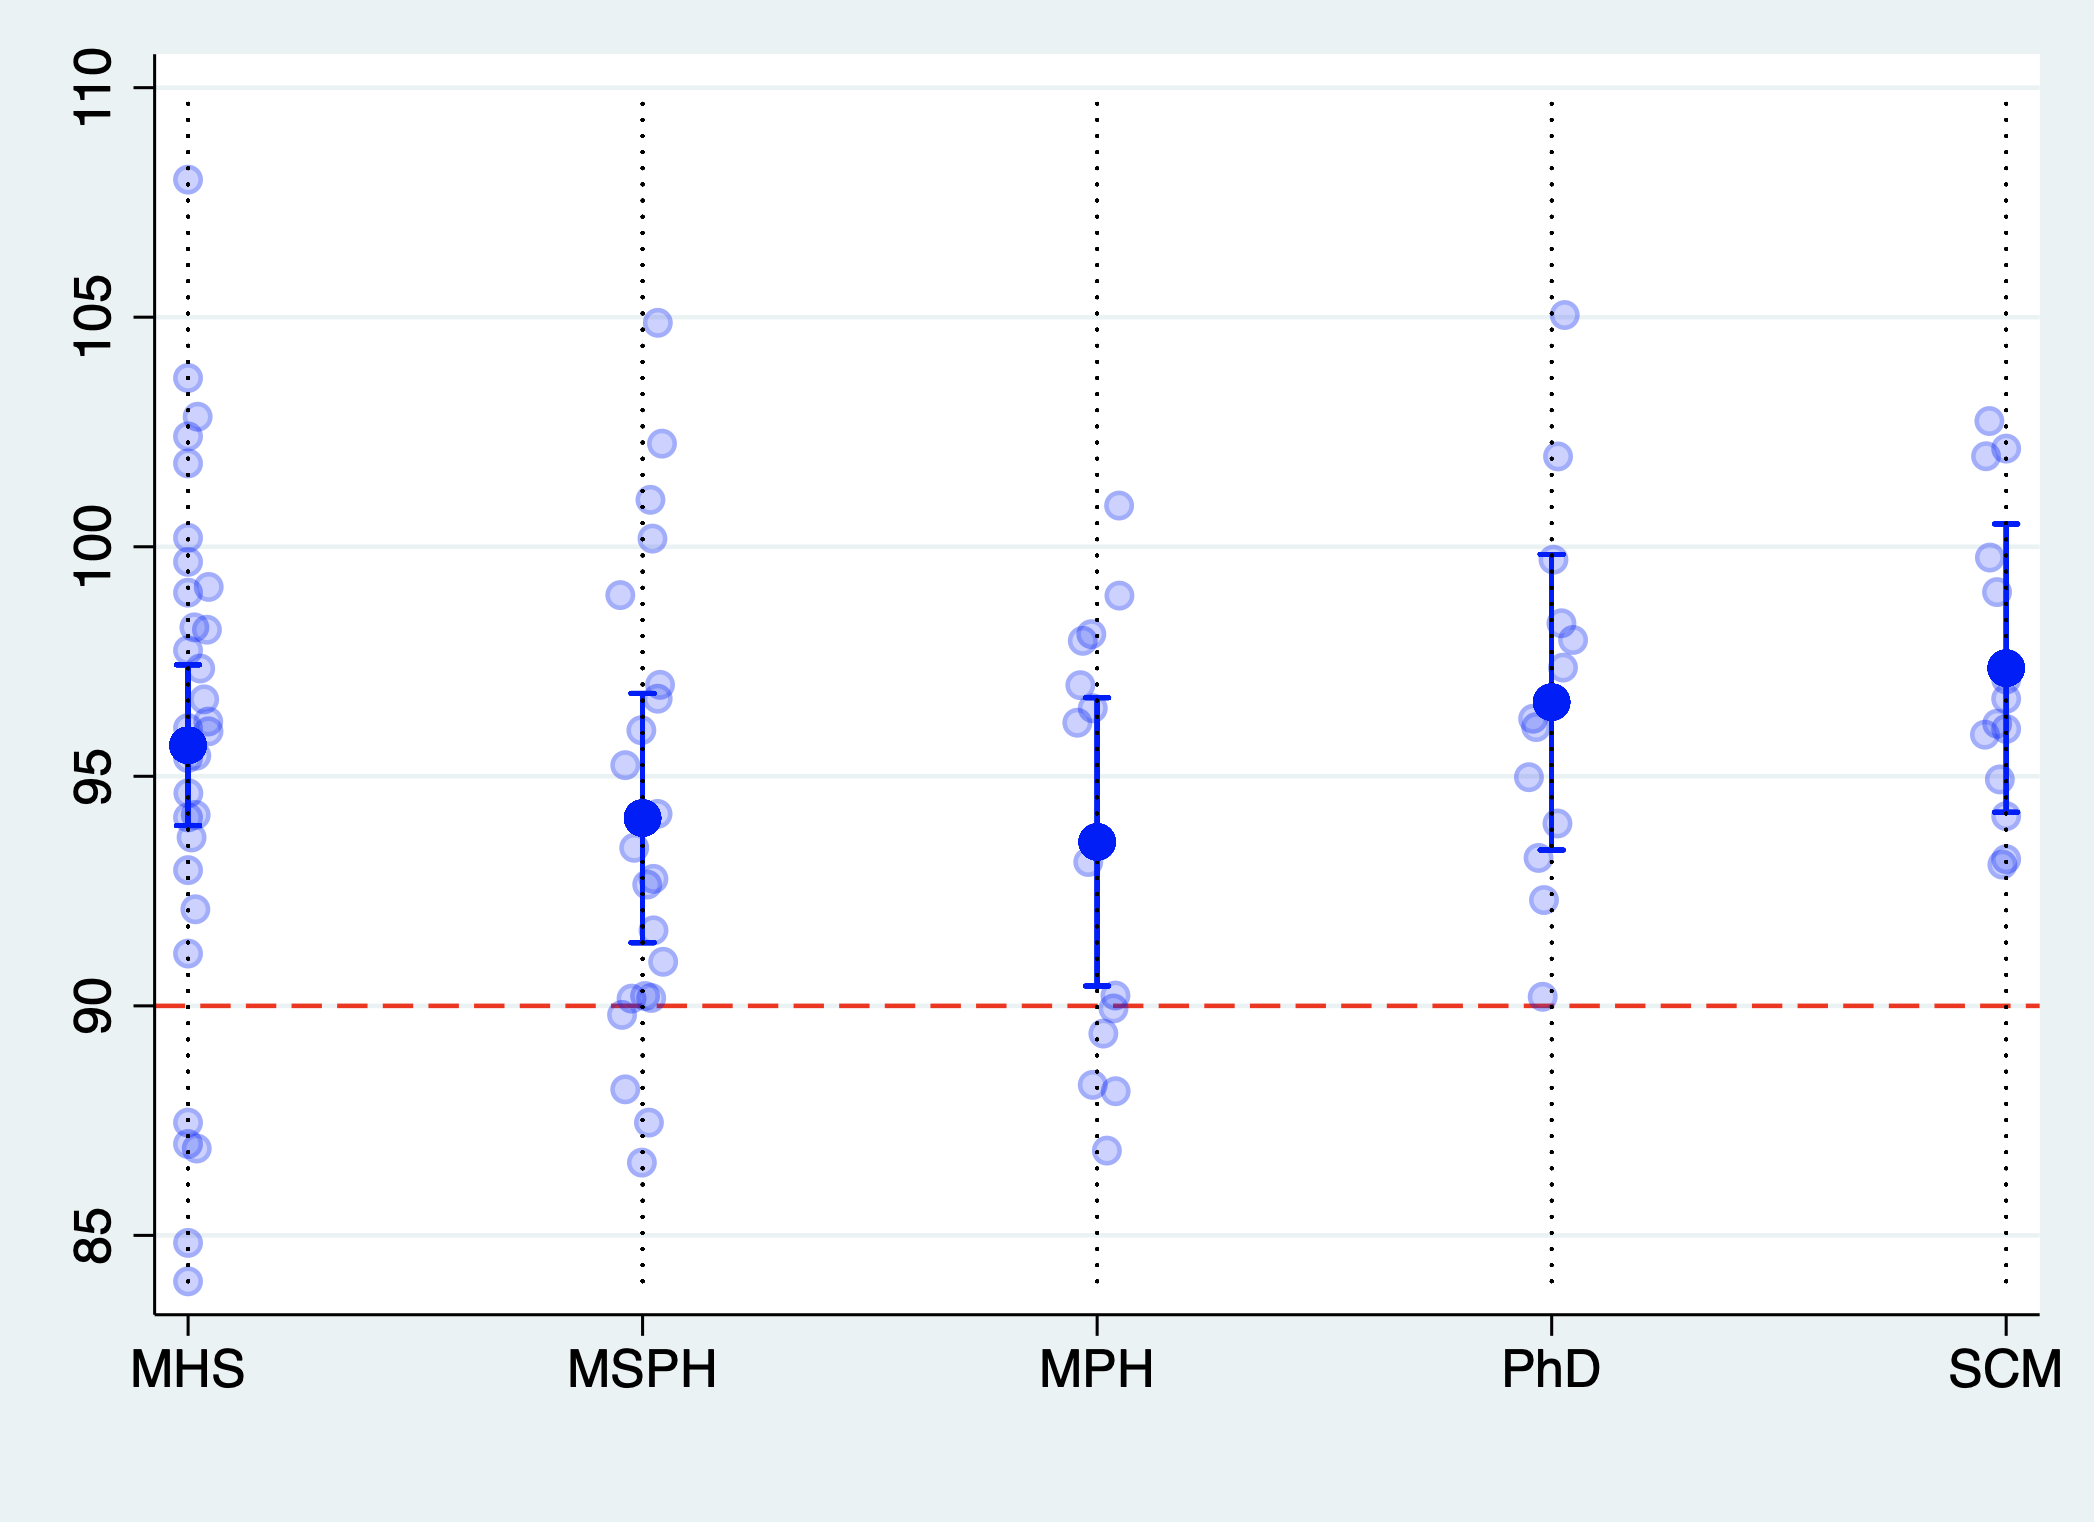
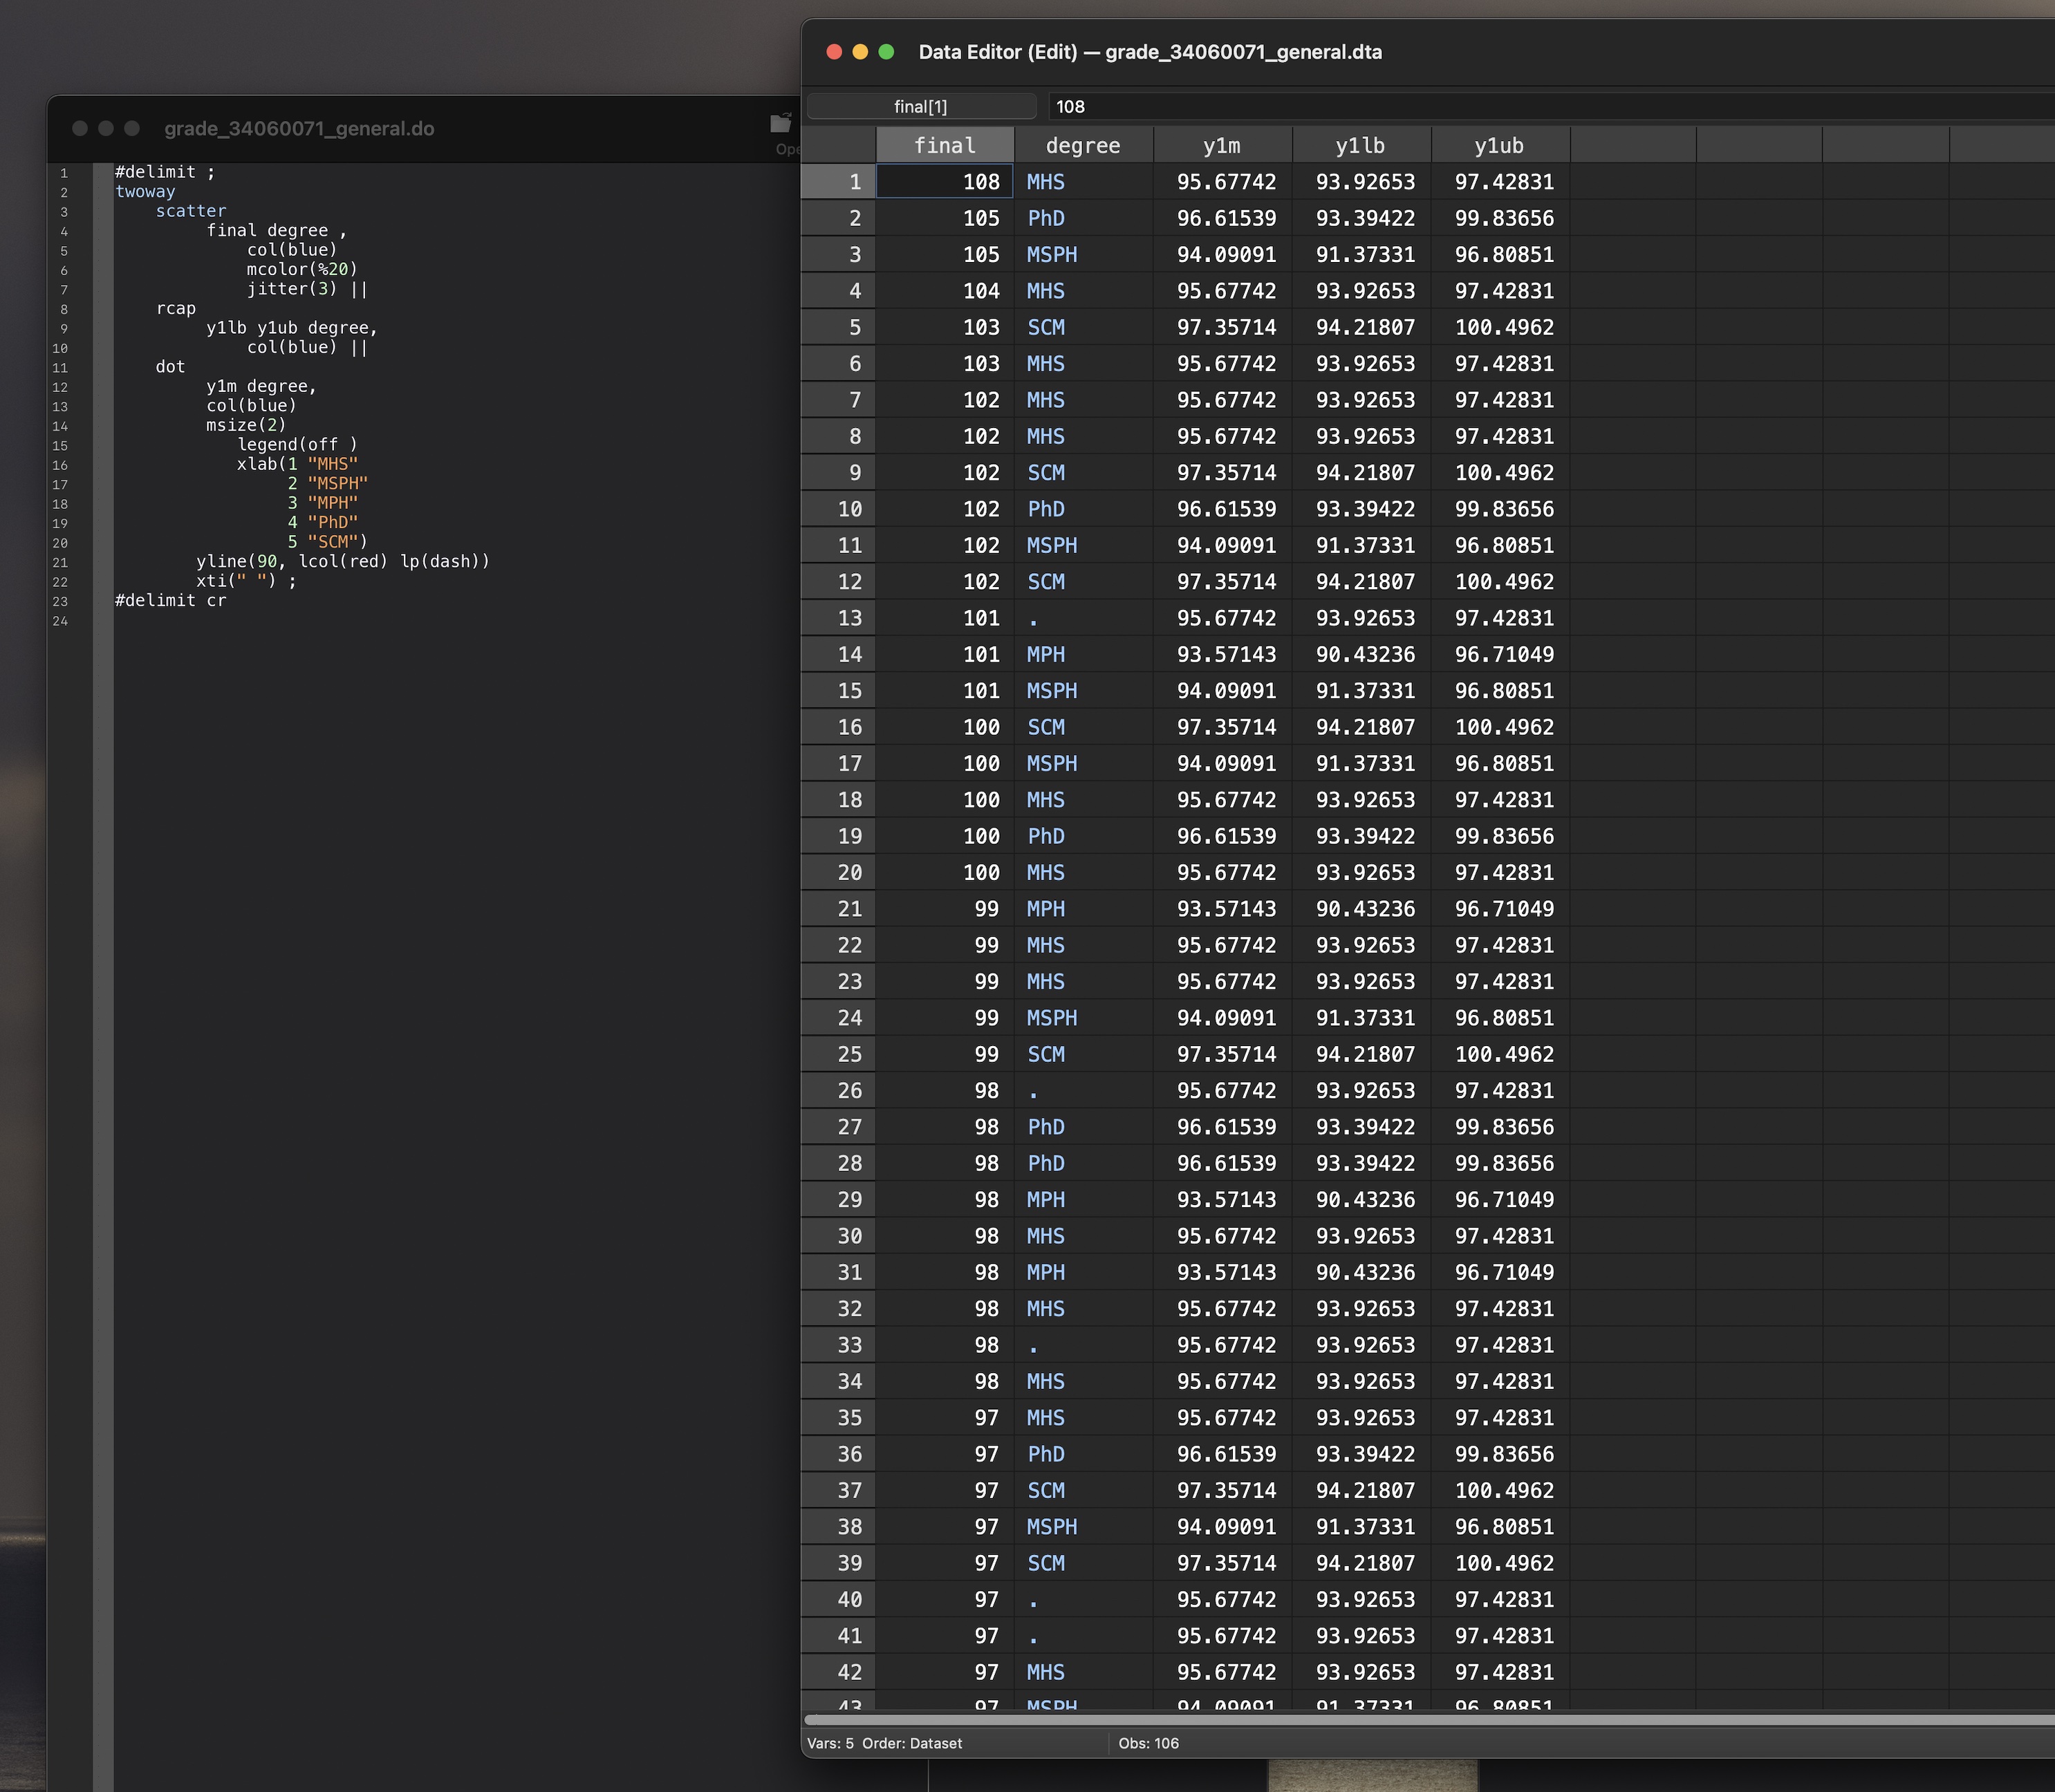
You can reproduce this plot
#delimit ;
twoway
    scatter
	     final degree ,
	         col(blue)
			 mcolor(%20)
			 jitter(3) ||
	rcap
	     y1lb y1ub degree,
		     col(blue) ||
	dot
	     y1m degree,
		 col(blue)
		 msize(2)
			legend(off )
			xlab(1 "MHS"
			     2 "MSPH"
				 3 "MPH"
				 4 "PhD"
				 5 "SCM")
		yline(90, lcol(red) lp(dash))
		xti(" ") ;
#delimit cr
See also
Earn up to 1.5 bonus points for rendering this in Python, with interactive graphics!
De-identified grades
Conclusion?
The odds of an A is 1/4. Basically, an A in this class is nothing to write home about. You’d likely lose money with these odds because the market place expects an A from you. Our teaching team will do its best to keep the odds this way or even make them shorter :)
See also
The following code introduces a random disturbance to the data in the screenshot above: grade_34060071_general.dta.
Use the outputed data file to reproduce the plot of 2021/2022 grades. Up to 1.5 bonus points
#
#delimit cr
quietly {

	if 1 {

		//reverse engineering?
		//set seed 340600

		global filename grade_34060071_general
		global vars final y1m y1lb y1ub

	}

	if 2 {

		use ${filename}.dta, clear

	}

	if 3 {

        g disturbance=rnormal(0,3)
		sort disturbance //further de-identifying..

	}

	if 4 {

		forvalues i=1/4 {

			local vars: di word("$vars",`i')
			replace `vars' = `vars' + disturbance

		}


	}

	if 5 {

		drop disturbance
		export delimited using "${filename}.txt", replace

	}

}